Kerbal Weather Project
Meteograms
The following graphs show several meteorological variables with respect to time. This type of plot, called a meteogram, is used by meteorologists to examine the time-evolution of weather at a particular location. Below, meteograms show the first year of weather data at each launch site in the base game. For each site, two meteograms are provided. The first shows the time-evolution of surface variables such as wind, temperature, humidity, and pressure. The second meteogram displays time-series of precipitation and sky-cover (i.e., cloud cover). In each meteogram time is displayed, on the x-axis, by the day of the year. On Kerbin, one year is approximately 426 days. The meteorological variable displayed is labeled on the y-axes. Above each plot, a legend indicates which fill color or marker corresponds to each variable.
The Kerbal Space Center (KSC)
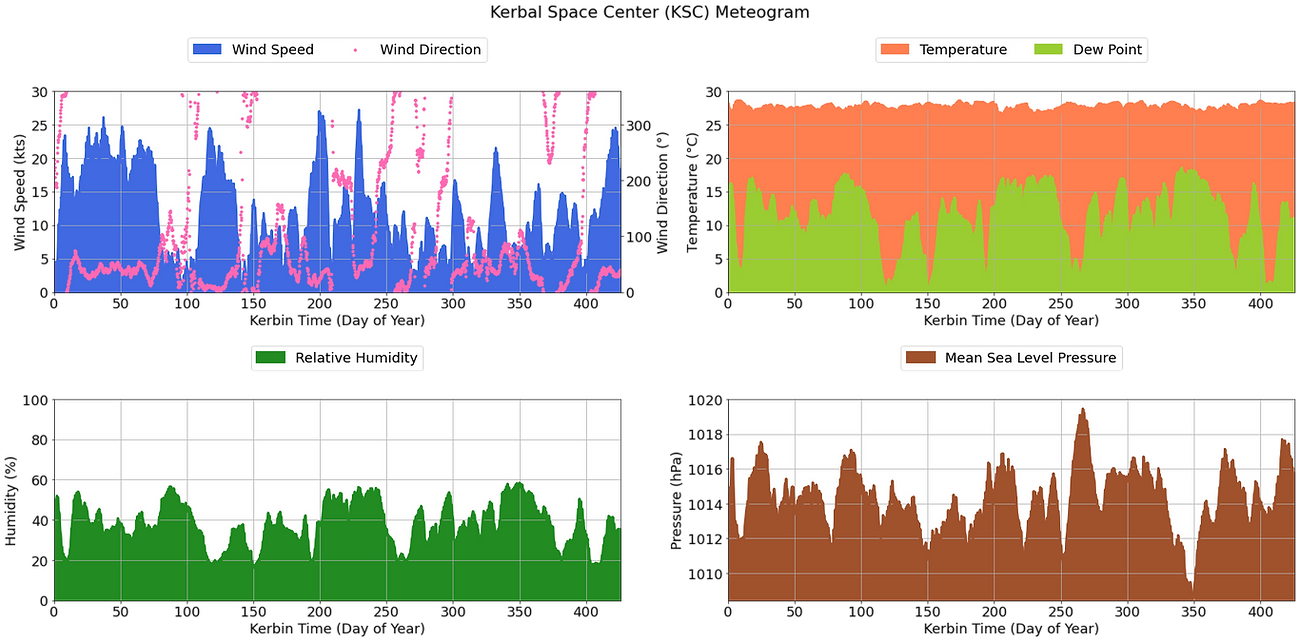
The meteogram above displays surface conditions at the KSC during the first year of the MPAS simulation. On the top right, time-series of wind speed and direction are shown. Throughout most of the year, the wind direction remained northwesterly (i.e., between 30° and 60°). During the first 100 days of the year, daily wind speeds often exceed 20 knots (10.2 m/s). In the second half of the year, surface winds at the KSC were notably weaker, averaging around 11 knots (5.6 m/s). Over the course of the year, the temperature at the KSC hovered around 27°C, exhibiting very little variance. In contrast, the dew point temperature was considerably more variable resulting in relative humidity that varied from 20% to 60% throughout the year. Shifts in humidity were sometimes associated with wind shifts. For example, around day 400 the relative humidity declined as winds at the KSC shifted from northeasterly (onshore) to northwesterly (offshore).
The lack of variability in temperature at the KSC is a consequence of latitude, proximity to water, day length, and limited model resolution. The KSC is located near the equator in the tropics. In the tropics the atmosphere is mostly barotropic, that is: it lacks large horizontal gradients in temperature. The lack of temperature gradients (i.e., fronts) implies a more uniform distribution of temperature in the tropics. Furthermore, the location of the KSC along a coastline and the short 6-hour day length on Kerbin reduced diurnal (day-night) variations in temperature. The warm ocean next to the KSC kept temperature warm at night and cool during the day, especially since the prevailing wind at the KSC was onshore (i.e., north-easterly). Since the day-length on Kerbin is 6-hours, the land surface only has around 3-hours to heat (cool) during the day (night). In the tropics, heat exchange is typically dominated by latent heating instead of sensible heating. Latent heating occurs when the sun’s energy is used to induce phase changes of water (i.e. evaporation/condensation) while sensible heating occurs when the sun’s energy raises the temperature of the air through conduction, convection, or radiation. Consequently, the dew point temperature (i.e., moisture content of the atmosphere) is affected by latent heating while the air temperature is affected by sensible heating. Since latent heating is the principal form of heating at the KSC the dew point temperature varies considerably more than the temperature. A final contributing factor to the lack of temperature variability at the KSC is limited model resolution. The coarse resolution of the MPAS model may have underestimated the temperature variability at the KSC. The model poorly resolved the terrain to the west of the KSC, potentially missing orographic circulations (i.e. downslope winds) that could have increased the local temperature variability at the KSC.
Due to its equatorial latitude, the KSC does not experience hurricanes (i.e. tropical cyclones). The Coriolis force reaches a minimum at the equator inhibiting hurricane formation. In addition, the variation of the Coriolis force near the equator tends to deflect hurricanes poleward, preventing them from crossing the equator. Since hurricanes are really the only source of large pressure variations in the tropics, changes in mean sea level pressure (MSLP) at the KSC are quite small. Over the entire year, the MSLP varied by less than 10 hPa. This small variation in pressure is a consequence of the barotropic nature of the tropical atmosphere. In a barotropic atmosphere, both temperature and pressure gradients are very weak.
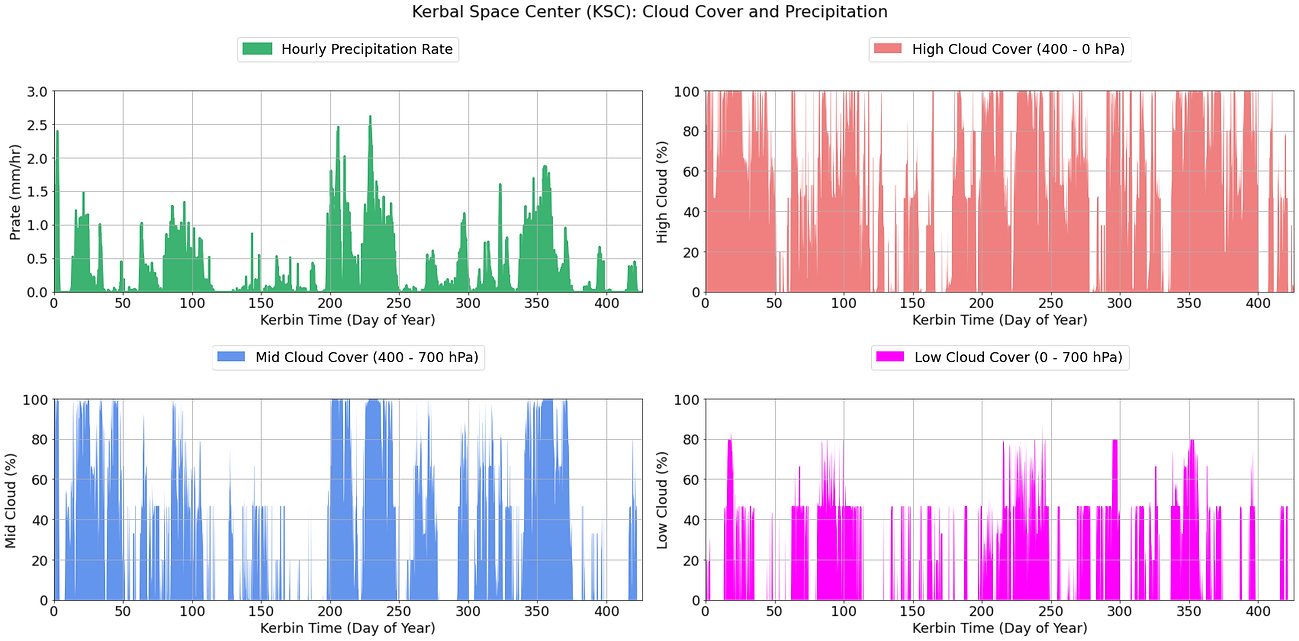
Cloud cover and precipitation at the KSC, during the first year of the MPAS simulation, is displayed in the meteogram above. Precipitation at the KSC is not uncommon due to its location along the coast near the equator. When precipitation does occur it is typically convective in nature (i.e., associated with thunderstorms), resulting in moderate (> 0.5 mm/hr) to heavy precipitation (2 mm/hr). During this year measurable precipitation (> 0.02 mm/hr) at the KSC occurred around 66% of the time and heavy precipitation around 1% of the time. Surprisingly, these precipitation frequencies are similar to those estimated by atmospheric general circulation models (i.e. climate models) for Earth equatorial region (Kong et al. 2020).
It should be noted that convective precipitation is often intermittent, complicating the calculation of the precipitation rate (Trenberth et al., 2017). Since MPAS produces model output each hour the precipitation rate was calculated using the accumulated hourly precipitation. So, if precipitation was intermittent and lasted less than an hour the rain rate was underestimated. Consider a brief thunderstorm over the KSC which produces 1 mm of rain and lasts 10 minutes. If no other precipitation occurred within the hour the hourly precipitation rate would be 1 mm/hr, even though the rain rate was actually 0.1 mm/min or 6 mm/hr. Another complicating factor is the limited resolution of the MPAS model simulation, which like other coarse-resolution climate models, typically overestimates the frequency of light precipitation and underestimates the frequency and intensity of heavy precipitation (Kong et al., 2020).
If you were to look up, on any given day at the KSC, you would likely see a layer of wispy cirrus clouds high above. In general, high-level clouds are more prevalent in the tropics while low and mid-level clouds are more common at high latitudes (Stengel et al. 2018). At the KSC, there are many days when cirrostratus clouds cover much of the sky. Nevertheless, cirrus clouds are often relatively transparent. bright sunny days would not be uncommon at the KSC. Mid-level cloud cover (e.g. altostratus) at the KSC is typically associated with precipitation. This is perhaps most notable between days 200-250 when a high percentage of mid-level cloud cover was coincident with the onset of precipitation. In contrast to mid and high-level clouds, low-level clouds were never responsible for overcast conditions at the KSC. Still, low clouds were present during the majority of days during the year. These low-clouds are most likely scattered (shallow) cumulus clouds, which would explain why the percentage of low-cloud cover is typically around 40%. The low percentage of low-cloud may also be a consequence of limited model resolution. Low-clouds are notoriously difficult to represent in weather and climate models since their spatial scales (~a few km) are typically much smaller than the typical model grid spacing (~ a few hundred km). For this reason, clouds in weather and climate models are parameterized. While climate models have gotten better at simulating cloud cover (Kay et al., 2012) they tend to underestimate low-cloud cover in the tropics (Chandra et al., 2015; Zhang et al., 2019).
Given the information on cloud cover, provided in the meteogram above, this image portrays what a kerbal might see on a typical day at the KSC:


Caption: View along the KSC coastline, looking east out toward the ocean on a typical day. Scatter cumulus are visible beneath a layer of cirrostratus.
The Desert Launch Site (DLS)

The meteogram above displays surface conditions at the DLS during the first year of the MPAS simulation. On the top right, time-series of wind speed and direction are shown. Throughout the year the wind direction mostly oscillated between easterly (90°) and southerly (180°). During this period, the average wind speed at the DLS was around 13 knots. Temperatures at the DLS were cooler and more variable than at the KSC, ranging from 11°C to 24°C. The larger temperature variance at the DLS can be attributed to its inland location and relatively arid climate. The DLS is far from large bodies of water which generally have a moderating influence on temperature. Furthermore, the amount of moisture in the air at the DLS is typically lower than at the KSC. The relative humidity at the DLS is, on average, a mere 25%. Since less moisture is in the air, less of the sun’s energy is spent on latent heating (i.e., phase changes of water) increasing the range in air temperatures. Temperatures at the DLS are cooler than at the KSC due to differences in elevation between the two launch sites. The DLS is located nearly a kilometer above sea-level while the KSC is at sea-level. In the troposphere, the temperature typically decreases with height.
Due to its inland location, the DLS did not experience large pressure drops associated with tropical cyclones. Like temperature, the variance of MSLP was generally larger at the DLS than at the KSC. The wind direction at the DLS was closely tied to changes in pressure. Before (after) the MSLP dropped winds tended to shift in clockwise (counter-clockwise) direction. Occasionally, these wind shifts were associated with an increase in wind speed. For example, around day 290 the wind shifted from southerly to northeasterly as the MSLP began to fall (from 1020 hPa to 1012 hPa). After the MSLP dipped and began to climb again, the wind increased in strength and shifted from northeasterly to southwesterly. In the sounding discussion, the turning of the wind was related to changes in temperature. At the DLS this was not the case. Like the KSC, the DLS is located in the tropics where the atmosphere is mostly barotropic and the horizontal distribution of temperature is relatively uniform.

The meteogram above shows cloud cover and precipitation at the DLS, during the first year of the MPAS simulation. Precipitation at the DLS was relatively sparse, compared to the KSC. When precipitation did occur it is was typically light and concentrated in short bursts. Unlike the KSC, heavy precipitation (>2 mm/hr) never occurred at the DLS during the year-long period examined above. During the year, measurable precipitation (> 0.02 mm/hr) at the DLS occurred around 25% of the time in contrast to 66% of the time at the KSC. Precipitation occurs more frequently at the DLS than expected for a desert on Earth. This may be a consequence of the limited resolution of the MPAS model, which like other coarse-resolution models tends to overestimate the amount of light precipitation (Kong et. al 2020). Another contributing factor to the relatively high precipitation frequency at the DLS is the fact that it is located near the equator. Equatorial regions typically lack deserts as converging trade winds result in vertical motion facilitating convection and precipitation. On Earth, almost all deserts are located in the subtropics around the latitudes 30 S and 30 N. This is because, in the subtropics, the descending branch of the Hadley Cell leads to subsidence and suppression of precipitation. The only equatorial desert on Earth is located in Somalia, where cold ocean waters (due to coastal upwelling), rain shadowing from the Ethiopian Highlands, and the moisture diverting Asian monsoon all work to reduce precipitation to a minimum.
Given that Kerbin has a Hadley cell like Earth, it's not clear how KSP’s desert biome, which straddles the equator, could form on Kerbin. In the MPAS simulation, the lowest precipitation totals on the desert continent are observed between 10 and 20 N, where the descending branch of the Hadley cell suppresses rising motion and precipitation. An equatorial desert is observed on the continent east of the KSC due to a Kelvin wave, which acts to enhance precipitation over the ocean and suppress precipitation over land. If Kerbin's biomes were to be redesigned the desert biome should probably be shifted north by 10-20 degrees latitude, in accordance with the descending branch of the Hadley cell and observed precipitation minima in the MPAS climatology.
If you were to look up, on any given day, at the DLS you might see a scattered mix of cirrus and altostratus clouds (see image below). At the DLS, mid-level clouds (e.g., altostratus, altocumulus, etc.) are more common than high-level clouds (e.g., cirrus, cirrostratus, etc.). There were a few days throughout the year when skies were overcast. On many of these days, cirrus clouds covered the sky, however, due to their relative transparency the sun would still shine at the DLS. Mid-level cloud cover was most common at the DLS. Increases in mid-level cloud cover coincided with precipitation. Low-level clouds were much less frequent at the DLS than at the KSC. When low clouds were present they were sparse, typically covering less than 20% of the sky. These low-clouds are most likely isolated shallow cumulus clouds. Like at the KSC, low-cloud cover may be underestimated at the DLS due to the difficulty of simulating small-scale clouds in coarse resolution models.
Given the information on cloud cover, provided above, the image below attempts to portray what a kerbal might see on a typical day at the DLS.

Credit: https://unsplash.com/@celsotrio
Caption: View at the DLS, looking toward the mountains south of the launch site. Precipitation at the DLS is light but not exceedingly rare, so sparse vegetation is visible. In the distance, the rising sun illuminates the high terrain and a mix of altostratus and cirrus clouds.
The Woomerang Launch Site (WLS)

Above, surface conditions at the WLS during the first year of the MPAS simulation are displayed. On the top right, time-series of wind speed and direction are shown. Throughout most of the year, the wind direction remained westerly. Relative to the KSC and DLS, the weather was considerably more variable at the WLS. Wind speeds averaged around 20 knots at the WLS and often exceeded gale force (> 34 knots). During periods when winds were weaker, high pressure was dominant. Between day 315 and 330, the MSLP exceed 1000 hPa, and wind speeds dropped below 10 knots. During this period temperatures declined and reached a minimum of around -50°C. In the mid-latitudes, High pressure is typically associated with weak winds, a lack of precipitation, and colder (dense) air. This type of high pressure is called a cold-core High. Conversely, cold-core Lows are associated with precipitation, stronger winds, and fronts.
The variability of MSLP at the WLS is much larger than at the KSC and DLS, which are both located in the tropics. Since the WLS is situated in the mid-latitudes it is regularly exposed to extratropical cyclones (i.e. low-pressure systems). Fronts associated with these cyclones are responsible for spikes in wind speed and dramatic changes in temperature at the WLS. In advance of a low-pressure system, southwesterly winds bring warm moist air over the WLS. As the low approaches, the pressure dips and a cold front passes. During this period, wind speeds increase and the wind shifts from southwesterly to northwesterly. Behind the cold front, pressure rises and the temperature and dew point rapidly fall. Wind speeds steadily decline as high pressure builds. This sequence of events is visible between day 110 and 120.
Compared to the DLS and KSC, the relative humidity was considerably higher at the WLS, rarely dipping below 40%. The higher humidity at the WLS may be attributed to the cold climate of the region and the location of the WLS on a peninsula (see map at bottom of page). Due to its peninsular location, the prevailing westerlies bring maritime polar air over the WLS. As this air rises over the high terrain of the peninsula it cools. Since the moisture content of the air does not change the relative humidity increases. Note that the WLS is a high elevation launch site. Since the resolution of the MPAS model is coarse (2 x 2 decimal degrees) it smooths and poorly resolves the high terrain around the WLS. This results in the elevation of the WLS being overestimated by several hundred meters, due to the proximity of the WLS to high terrain. As a result, temperatures at the WLS are very cold, averaging around -20°C. Although the relative humidity is typically higher at the WLS than at the DLS or KSC the actual moisture content of the air is lowest at the WLS. There is actually less water vapor in the air at the WLS than at the DLS or KSC. The moisture capacity of the air increases exponentially with temperature. Even though the relative humidity often exceeds 60% at the WLS, the air would still feel quite dry. Cold temperatures at the WLS ensure that only a minuscule amount of water vapor would be in the air.
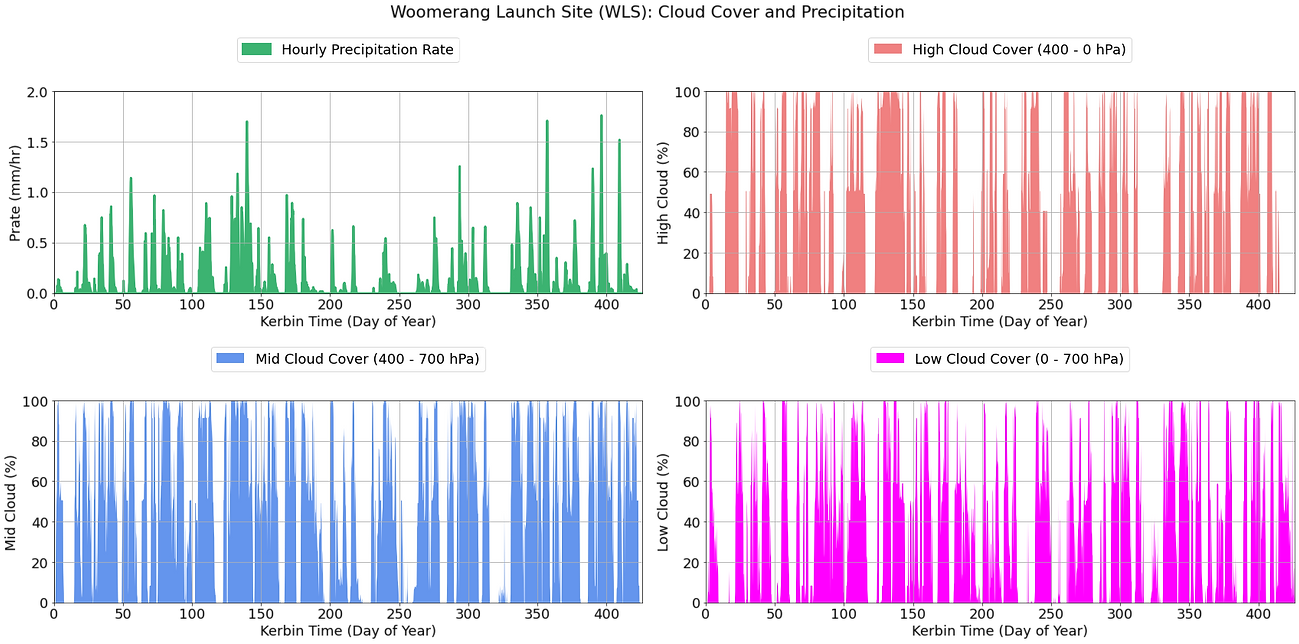
The meteogram above displays cloud cover and precipitation at the WLS, during the first year of the MPAS simulation. Precipitation at the WLS is common due to its location along a mid-latitude storm track. In contrast to the KSC, precipitation was typically stratiform and moderate in intensity. During this year-long period, measurable precipitation (> 0.02 mm/hr) at the WLS occurred around 50% of the time. Heavy precipitation (> 2mm/hr) was not observed at the WLS during this period. Note that precipitation at the WLS was frozen (i.e., snow) given that surface temperatures were rarely above 0°C. Since both the surface temperature and air temperature aloft were typically well below freezing, falling snowflakes would be dry with little to no liquid content. Note that precipitation rates are provided in liquid (water) equivalent. As temperatures are so cold at the WLS (-20°C) the snow to liquid ratio would likely be as high as 40:1. Given this ratio, a precipitation rate of 0.6 mm/hr would correspond to a snowfall rate of around 1 inch/hr (2.4 cm/hr).
On any given day, if you gazed up at the sky above the WLS you might see much of the sky covered in low-level stratus clouds. At the WLS, low-level cloud cover was often much greater than at the KSC or DLS. Given the light, to moderate intensity of precipitation and the cold atmosphere aloft, these low-level clouds are most likely stratus or stratocumulus clouds. Mid-level and high-level cloud cover at the WLS is just as frequent as low-level cloud cover implying that multiple cloud layers are often observed. This is a common occurrence in advance of a warm front associated with an extratropical cyclone. High-level clouds (e.g. cirrus and cirrostratus) are often the first to appear in advance of a low-pressure area. As the low and warm front approaches, mid-level clouds (e.g. altostratus) appear aloft. These are followed by nimbostratus (precipitating stratus) and stratus. This sequence of cloud cover is actually observed around day 125 when high-level cloud cover precedes mid-level cloud cover, low-level cloud cover, and precipitation.
The image below provides a rough portrayal of what a kerbal might see on a typical day at the WLS.

Credit: https://unsplash.com/@colemader
Caption: View from an area around the WLS, looking south toward the mountains. Snow covers the landscape while a dim gray layer of stratus clouds drifts above. The stratus clouds block out much of the sun's light, darkening the scene.
The map below is provided for reference. The meteograms discussed above were retrieved at the base game launch sites marked in black

References:
Chandra, A. S., Zhang, C., Klein, S. A., & Ma, H.‐Y. (2015). Low‐cloud characteristics over the tropical western Pacific from ARM observations and CAM5 simulations. Journal of Geophysical Research: Atmospheres, 120, 8953–8970. https://doi.org/10.1002/2015JD023369
Kay, J. E., and Coauthors, 2012: Exposing Global Cloud Biases in the Community Atmosphere Model (CAM) Using Satellite Observations and Their Corresponding Instrument Simulators. J. Climate, 25, 5190–5207, https://doi.org/10.1175/JCLI-D-11-00469.1.
Kong, X., A. Wang, X. Bi, X. Li, and H. Zhang, 2020: Effects of Horizontal Resolution on Hourly Precipitation in AGCM Simulations. J. Hydrometeor., 21, 643–670, https://doi.org/10.1175/JHM-D-19-0148.1.
Stengel, M., Schlundt, C., Stapelberg, S., Sus, O., Eliasson, S., Willén, U., and Meirink, J. F., 2018: Comparing ERA-Interim clouds with satellite observations using a simplified satellite simulator, Atmos. Chem. Phys., 18, 17601–17614, https://doi.org/10.5194/acp-18-17601-2018
Trenberth, K., Y. Zhang, and M. Gehne, 2017: Intermittency in precipitation: Duration, frequency, intensity, and amounts using hourly data
. J. Hydrometeor., 18, 1393–1412, https://doi.org/10.1175/JHM-D-16-0263.1.
Zhang, Y., Xie, S., Lin, W., Klein, S. A., Zelinka, M., Ma, P.‐L., Rasch, P. J., Qian, Y., Tang, Q., & Ma, H.‐Y. (2019). Evaluation of clouds in version 1 of the E3SM atmosphere model with satellite simulators. Journal of Advances in Modeling Earth Systems, 11, 1253–1268. https://doi.org/10.1029/2018MS001562