Kerbal Weather Project
A state-of-the-art numerical weather model (MPAS) was run for five years to simulate the weather on Kerbin. An hourly climatology of Kerbin was developed by averaging the results of this five-year long simulation by the hour.
Surface Analyses
Surface analyses depict weather conditions at ground level. These charts are useful for identifying surface weather features such as High/Low pressure systems, frontal zones, and thunderstorms. The collection of surface charts below show the long-term average weather (climatology) of Kerbin. In all of these charts, grey lines depict landmasses while gridded white lines show parallels of latitude and meridians of longitude.
Meteorological Surface
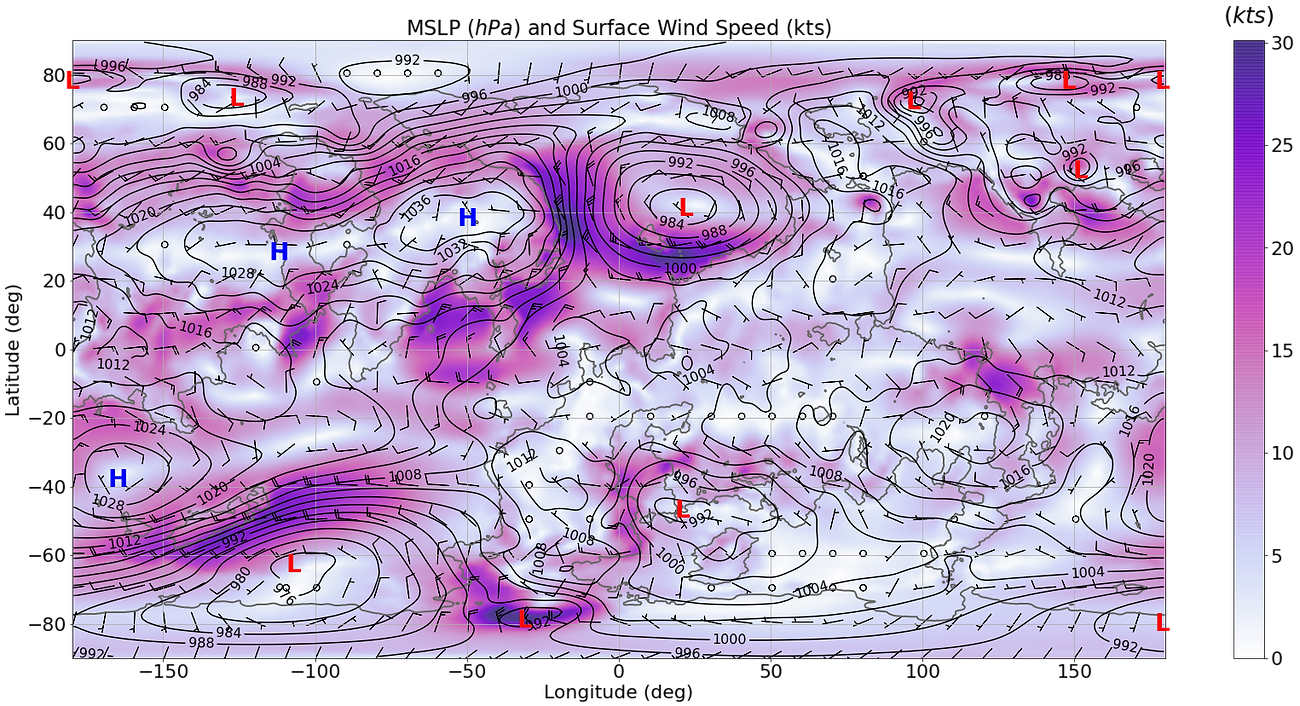
This figure displays the climatological mean sea level pressure (contoured) and surface wind speed (shaded). Darker colors show regions where wind speed is higher while lighter colors show regions where the wind speed is lower. Climatological low and high-pressure centers are labeled with a red (L) and blue (H), respectively. Wind barbs indicating the velocity (i.e., speed and direction) of the wind are drawn in black. Winds are stronger over oceanic regions where friction with the surface is less than on land. Strong winds are also observed in the vicinity of low-pressure centers where contours of constant pressure (isobars) are closely packed (i.e., where the pressure gradient is large). Winds rotate around low-pressure centers in a cyclonic (counter-clockwise) fashion. Note that unlike in upper air analysis, wind barbs frequently cross the contours (isobars). This is a consequence of friction which slows the wind down producing a force imbalance that causes the wind to adjust and turn toward lower pressure. Thus, near the surface, winds converge around Lows and diverge around Highs. Convergence at the surface contributes to rising motion, clouds, and precipitation. In contrast, divergence at the surface is associated with subsidence (sinking air) and dry quiescent weather.

The climatological mean sea level pressure (contoured) and surface air temperature (shaded) are shown above. Climatological low and high-pressure centers are labeled with a red (L) and blue (H), respectively. Wind barbs indicating the velocity (i.e., speed and direction) of the wind are drawn in black. The freezing line or 0°C isotherm is depicted as a dashed cyan contour. Note that the air temperature over Kerbin’s southern and northern ice sheet is remarkably cold (-50°C and -70°C, respectively). Recall that Kerbin’s ice sheets are relatively thin, sitting atop land that is just above sea level. The northern hemisphere (N.H.) has more land mass than the southern hemisphere, which has more ocean than land. Since the land surface warms/cools faster than the ocean, temperature extremes are enhanced over land. The moderating influence of the ocean on near-surface temperatures declines with distance from the coastline. Since the northern ice sheet is bordered by two continents temperatures over the ice sheet are extremely cold. In contrast, the southern ice sheet has a long coastline and is largely surrounded by water. For this reason, air temperatures over the southern ice sheet are typically warmer than over the northern ice sheet.
Outside the polar regions, cold temperatures are observed in regions of high terrain. Over the KSC continent, the surface air temperature dips below freezing as far south as the tropic of cancer (23.5°N). This mountainous region, between -80°W and -20°W, has an average elevation well over 1 km ASL and contains peaks that exceed 4-km in height. In the troposphere, the air temperature decreases with height at a rate of around -6.5°C/km. Consequently, surface temperatures in regions of high terrain are cooler than temperatures at sea level, along the same line of latitude. The presence and accumulation of snow in regions poleward of the freezing line also contribute to cooler temperatures by reflecting sunlight and reducing the local albedo.
Relative to land, surface air temperatures over the ocean are quite warm. The freezing line (0°C isotherm) extends further poleward over the ocean than over land. The ocean transports heat from the tropics toward the poles and has a higher heat capacity than land. Due to its high heat capacity warm ocean water, moving from the tropics toward the poles is slow to cool. This poleward transport of heat contributes to warmer air temperatures over the ocean in the mid-latitudes (30° - 60°) as relatively warm ocean water heats the air directly above.

This figure displays the climatological mean sea level pressure (contoured) and surface relative humidity (shaded). Darker colors show regions where the humidity is higher while lighter colors show regions where the humidity is lower. Climatological low and high-pressure centers are labeled with a red (L) and blue (H), respectively. Wind barbs indicating the velocity (i.e., speed and direction) of the wind are drawn in black. The surface relative humidity is generally higher over the oceans and lower over deserts/badlands where vegetation is more sparse. Consequently, the relative humidity is lower over the badlands of the eastern continent (20°E to 100°E) and over the desert continent to the west of the KSC (-100°W to -180°W).
It's important to note that relative humidity is not indicative of the actual amount of water vapor in the air. Even though the relative humidity is higher at the poles than over the subtropical deserts of Kerbin, the amount of water vapor in the air is greater over the desert regions. This is because the maximum amount of water vapor that can exist in the air decreases as temperatures get colder. At cold temperatures the maximum (saturation) vapor pressure of water is small. With a surface temperature of -50°C and a relative humidity of 50%, the water vapor pressure over the poles is approximately 0.03 hPa. Recall that mean sea level pressure is around 1000 hPa. This implies that water vapor is responsible for around 0.003% of the surface pressure at the poles. In contrast, in the desert/badlands of Kerbin’s the ambient temperature is around ~20°C and the relative humidity drops as low as 10%. At this temperature and humidity, the water vapor pressure is around 2.3 hPa (approximately 0.23% of sea level pressure). So, while relative humidity can be useful for assessing how humid the air is in regions where the ambient temperature is relatively warm, its utility in regions of extreme cold is limited. This is why some broadcast meteorologists chose not to show forecasts of relative humidity.
Oceanographic Analysis

The figure above displays the climatological mean sea surface temperature (shaded and contoured). Wind barbs indicating the velocity (i.e. speed and direction) of surface winds are drawn in white. The hatched white regions depict areas were sea-ice is present. Sea surface temperatures (SSTs) increase equatorward reaching temperatures as high as 30°C in the tropics. Over the ocean, the tropical trade winds are south-southeasterly in the southern hemisphere and north-northeasterly in the northern hemisphere. At mid-latitudes westerly winds are predominant. Wind speeds are generally higher over the ocean than over land as the ocean surface is smoother than the land surface, which is marked by mountain ranges and vegetation cover.
When SSTs drop below -2°C ocean water begins to freeze forming sea ice. The coastlines of the northern and southern ice sheets are prime regions for sea ice formation. The southern continent is largely encased by sea ice stretching many kilometers offshore. In the northern hemisphere, colder temperatures facilitate sea ice formation as far south as 50°N. Sea ice is present along the coastline of the northern ice sheet and along the northern coast of the KSC continent. Several small lakes are also encased in ice, north of the 60th parallel.

This figure displays the climatological mean ocean mixed layer depth (shaded and contoured). Wind vectors show the velocity (i.e. speed and direction) of surface winds (white) and ocean currents (tan). The hatched white regions depict areas where sea ice is present. Darker colors show regions where the ocean mixed layer is deeper while lighter colors show regions where the ocean mixed layer more shallow. Near the poles, the ocean mixed layer depth is enhanced in regions where sea ice forms. The formation of sea ice encourages mixing, as water evaporates to form ice it leaves behind saltier water that sinks and mixes with deeper water.
In the tropics (e.g. east of the KSC) frequent thunderstorm activity results in strong winds that promote turbulent mixing of ocean water and a deeper mixed layer. Further north, along the northeastern coastline of the KSC continent, the mixed layer depth is enhanced by the frequent passage of surface cyclones (i.e. low-pressure systems) which develop and intensify offshore. These synoptic (large-scale) storm systems produce fronts and strong winds that encourage mixing in the uppermost layer of the ocean. The fingerprint of these cyclones is present in the surface wind field which rotates counter-clockwise around the northern ocean (40°N, 10°E). In the northern hemisphere, winds rotate around areas of low pressure in a counter-clockwise fashion.
Note that ocean currents (tan) vectors tend to flow perpendicular to surface wind (white) vectors. Within the mixed layer, the net transport of ocean water is perpendicular to the surface wind due to the Coriolis effect. As the wind blows across the ocean, friction at the ocean surface causes water to move. When water at the ocean surface moves it drags a layer of deeper water beneath it, putting it into motion. This interaction between shallower and deeper water propagates downward through the mixed layer. The flow of water in each layer is deflected by the Coriolis effect; to the right in the northern hemisphere (N.H.) and to the left in the southern hemisphere (S.H.).
When the wind blows parallel to the coastline the Coriolis effect can cause surface waters to be pushed offshore. When this occurs water rises from below to replace the surface waters pushed away. This upward movement of colder, deep water is called upwelling. On Kerbin, upwelling occurs in the S.H. along the edge of the sea-ice that extends offshore from the southern continent (-150°W to -50°W). Here upwelling concert with the formation of sea ice produces the deepest ocean mixed layer on Kerbin. In the northern hemisphere, upwelling is observed on both sides of the peninsula where the Woomerang Launch site is located (45°N, 136°E).
Cloud and Precipitation Analysis

The climatological total cloud fraction (shaded) and mean sea level pressure (contoured) on Kerbin is displayed above. The total cloud fraction represents the fraction of the sky covered by clouds, with a value of one indicating total cloud cover and a value of zero indicating no cloud cover. Regions with darker shading typically have more cloud cover while regions with lighter shading tend to have clearer skies. On Kerbin, cloud cover is typically greater over the ocean than over land. The availability of moisture is higher over the ocean than on land, especially in the tropics. Converging trade winds over the tropical ocean foster the development of near-daily thunderstorms. These storms generate considerable amounts of cirrus clouds which spread downstream forming an anvil and increasing the total cloud cover over a broad region.
It should be noted that the total cloud fraction is indifferent to cloud type. That is, a model grid column containing only high-level cirrus clouds could report a total cloud fraction of one even though cirrus clouds are often optically thin (i.e. transparent to sunlight). While cirrus clouds are common in the tropics, low-level clouds are more typical at higher latitudes, especially over the poles. Low stratiform cloud cover over the poles contributes to greater cloud fraction over the southern and northern ice sheets. Total cloud fraction is also enhanced along the mid-latitude storm tracks (i.e. around low-pressure systems).
On land, lower cloud fraction is observed over the desert continent to the west of the KSC and in the mountainous region northeast of the KSC. This region is characterized by a broad region of high sea level pressure. High pressure is associated with sinking air motion (i.e. subsidence) which acts to suppress cloud formation. Over the continent to the east of the KSC, cloud cover generally decreases with distance from the coast, ranging from near 90% along the western coastline to around 50% in the interior of the continent.

This figure displays the climatological mean sea level pressure (contoured) and the total annual precipitation at Kerbin’s surface (shaded). Climatological low and high-pressure centers are labeled with a red (L) and blue (H), respectively. Annually, precipitation totals are highest along the intertropical convergence zone (ITCZ) where trade winds converge triggering frequent afternoon thunderstorms. The most active region of the ITCZ is just east of the KSC over there ocean where the availability of moisture is greatest. Outside the tropics, regions of enhanced precipitation are observed over the ocean and along the mid-latitude storm tracks downstream of climatological low-pressure centers. The lowest precipitation totals are observed on land over the poles and in the tropics.
Tropical precipitation is influenced by a type of atmospheric wave called a Kelvin wave. An example of a kelvin wave is shown in the upper-air analysis section of the webpage. On Kerbin, Kelvin waves enhance precipitation over the tropical ocean, east of the KSC. These waves also act to suppress precipitation over the western half of the central continent and the KSC continent. Around 15-25°N/S the descending branch of the Hadley cell (see climate comparison) also contributes to a reduction in average precipitation.
Both the southern and northern poles experience very little precipitation. The northern ice sheet in particular experiences the least precipitation due to its extremely cold temperatures. Recall, that the maximum amount of water vapor that can exist in the air decreases as temperatures get colder. Consequently, since there is so little water vapor over the poles the amount of precipitation there is minuscule. This is why polar ice caps and ice sheets are classified as deserts.